
Here is a post from Sailnet with my good friend, Colemj, where we are discussing the differences between iNavX and SEAiq. I’d just said I didn’t think SEAiq was nearly as good as iNavX. Colemj then explained why he used and liked it. And since Colemj is definitely NOT an idiot – and actually HAS an open mind and TONS of first-hand experience with this stuff – I listen…
Hey Mark – thanks for your input. Yours is an opinion/viewpoint I definitely respect.
I guess I should qualify my comments a bit. My newer iPad is at the office so I downloaded the Free SEAiq app (which gives you a trial of the full USA version) on my iPhone8 and that might have been part of the issue in terms of display. (Note: I had to do this because SEAiq is only available for iOS 10 which the iPad2 doesn’t support – where iNavX supports both).
So first let me address the info I found on this (which shaped my opinion) and then what I saw (which made me draw the above conclusion).
First, I know this app is used by professional mariners (e.g. – SEAia Pilot, etc.), so there’s no question it has to have great capabilities. The IHO official standards charts (S-52, 57, 63…) is definitely a plus. No question. But it was mostly the other implementations that seemed weak to me as I’ll explain below.
The charts I got with the free trial of SEAiq USA were the NOAA ENC charts. This was, if I recall, almost 300 charts at .5G. And for some reason it took FOREVER to download these even via WiFi. I don’t know if their server is slow or what – but it was excruciating.
Okay – my responses (Colemj’s points are in larger gray letters, my responses are in red below each of them)…
We have been using SEAiq for years, and have only played with iNavX a bit. My experience is different than yours, as I find SEAiq the most full-featured app (for us) available.
Things that make it good for our usage:
1. Complete NMEA integration over wifi (iNavX also) with flexible use of the data. For instance true and apparent wind and COG/heading can be displayed as vectors from ownship, as well as in instrument gauges/clusters.
This is a critical one for me obviously. The only device listed in the app for integration is the Vesper Marine XB-8000 – which is listed by them at $799. I assumed there were other options – [URL=”http://doc.seaiq.com/NMEA_WiFiHelp.html”]and see that there are here[/URL] – but don’t know much about most of what they are listing apart from the Digital Yacht: iAIS. What device are you using for the muxing?
2. Uses any and all chart formats, including charts I make from PDF files, Google Earth, and the like. This is a very important feature for us – maybe the most important. AFAIK, it is the only program on iPad to allow this. SEAiq also used to use CM93 charts, but bowed to pressure from CMAP and took out that support. We stopped upgrading at the last supporting version, so are probably missing other features that have been added since.
Wow – that’s cool that you can use personally made charts. I have no idea if iNavX will do that. But, to this issue – and your other post after – iNavX DOES support both raster and vector. I use Navionics+, which are vector charts which are updated daily. And I’ve been very impressed with their accuracy, readability, etc.
Do you use the IHO charts for outside US waters?
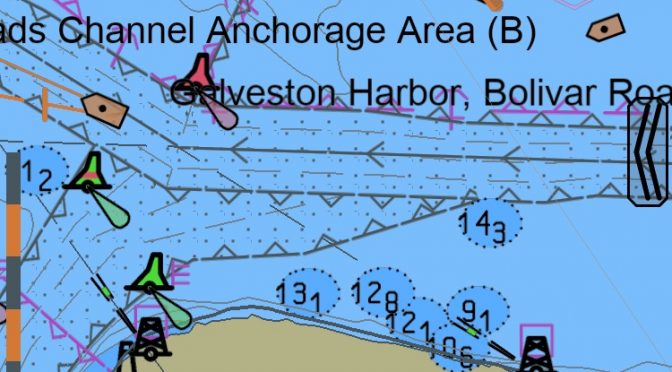
I just wasn’t impressed with the how SEAiq displayed the NOAA ENC charts of the very busy Galveston area we sail (again, on the iPhone which may be part of the problem)…
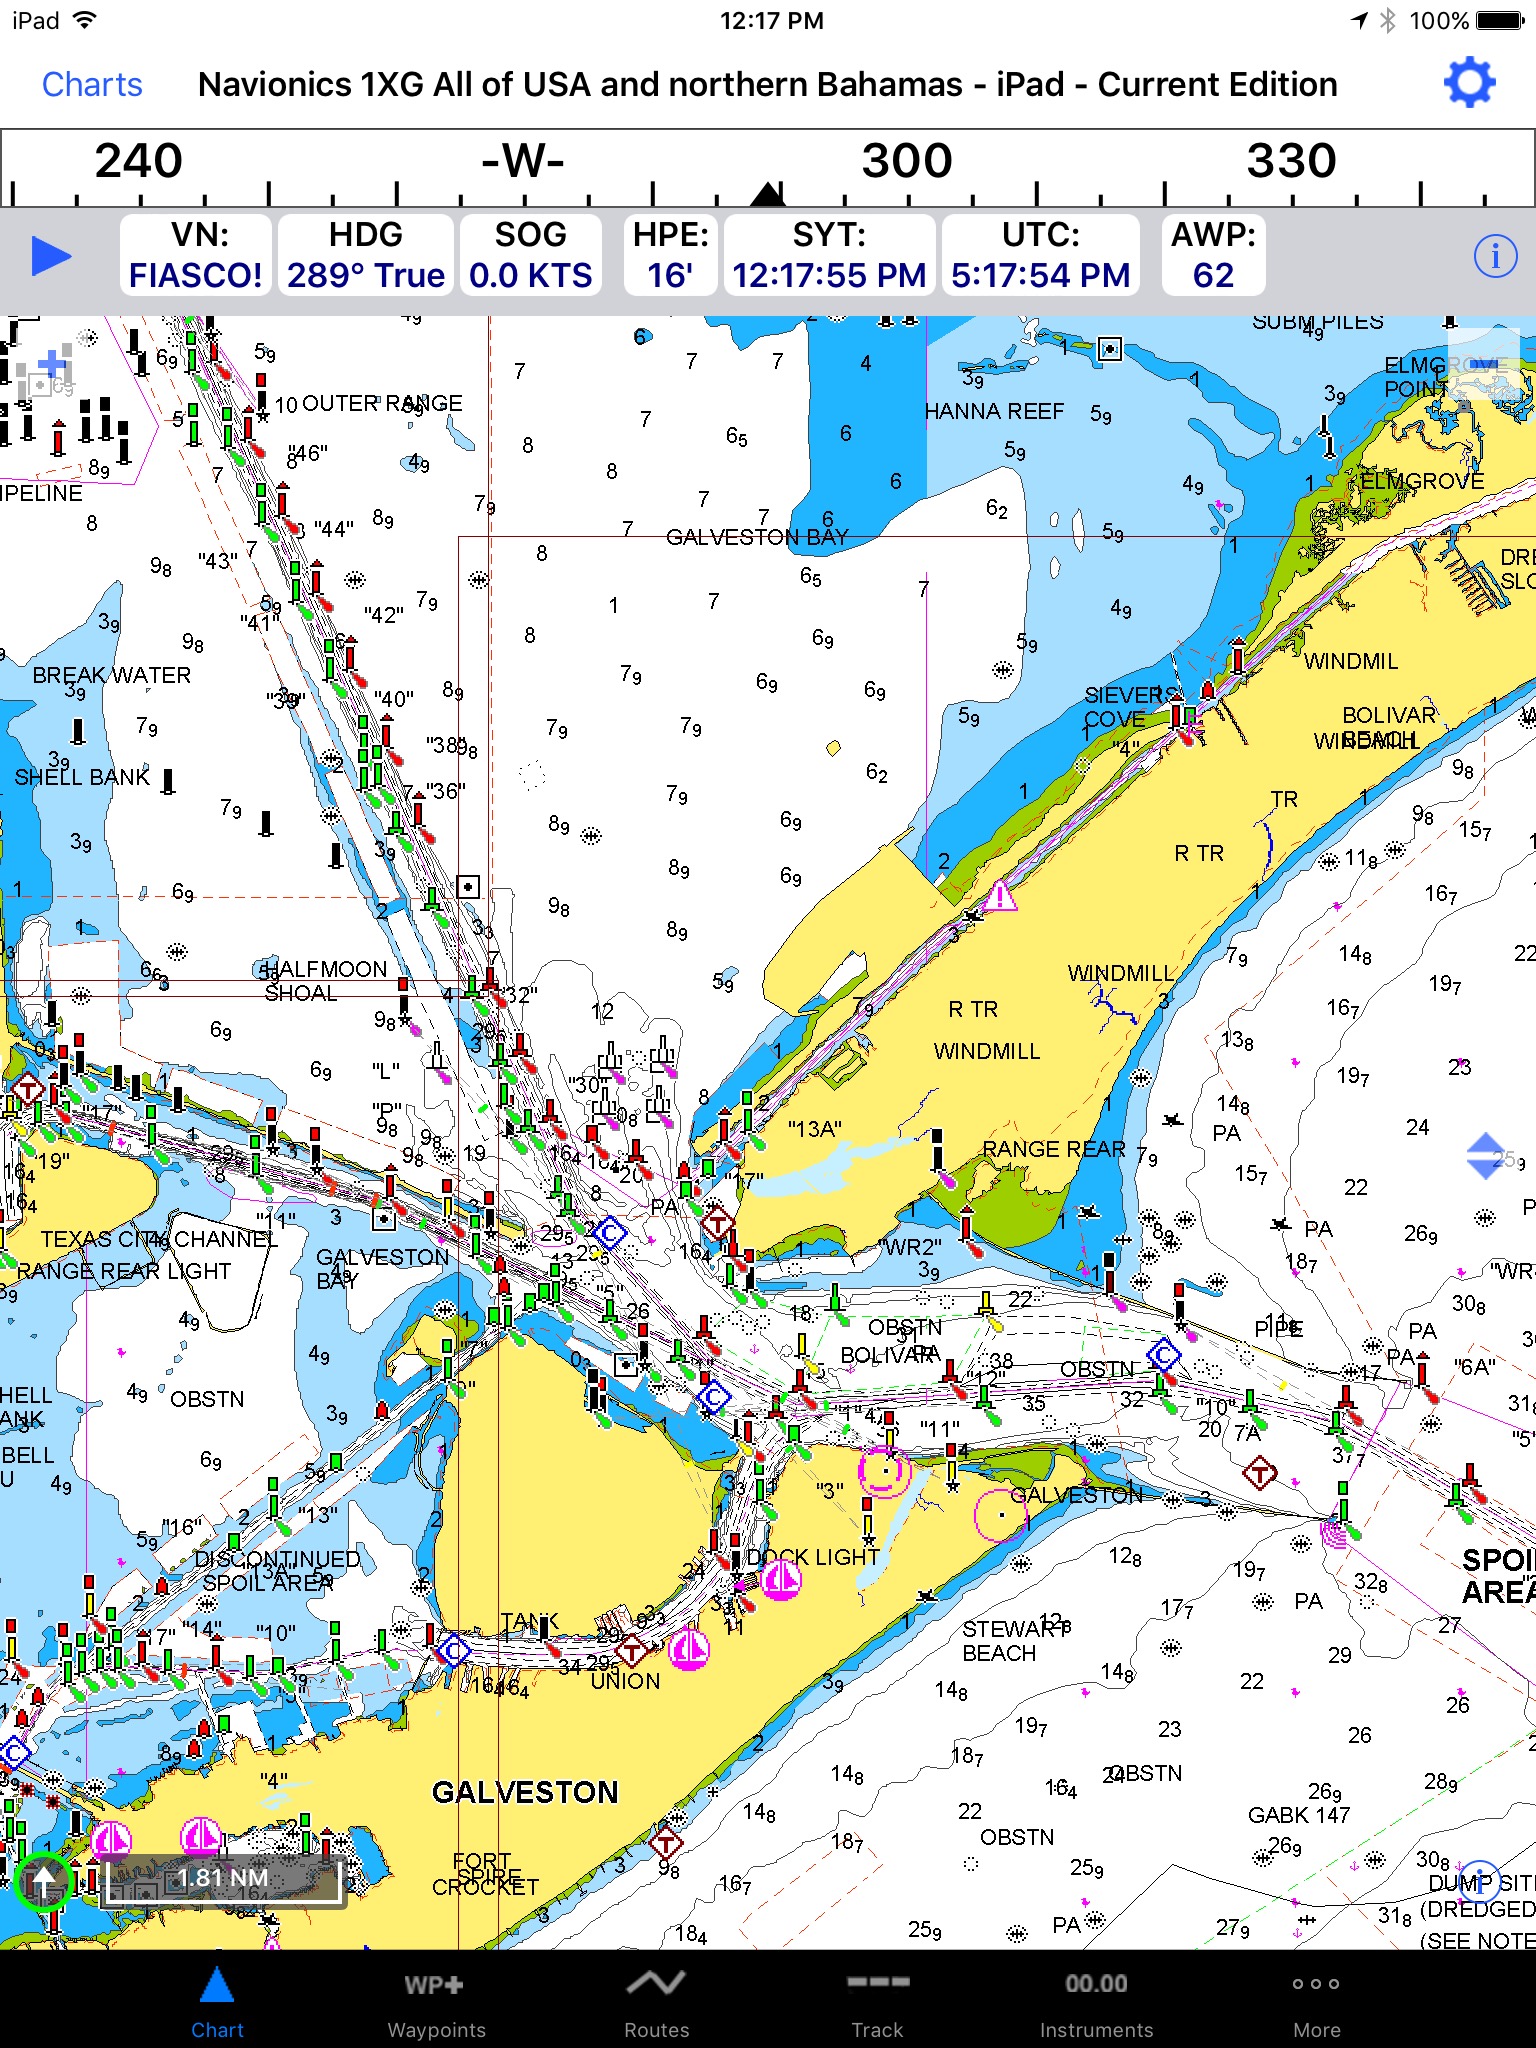
…compare that with the same view in iNavX with Navionics+ vector charts (on the iPad2)…
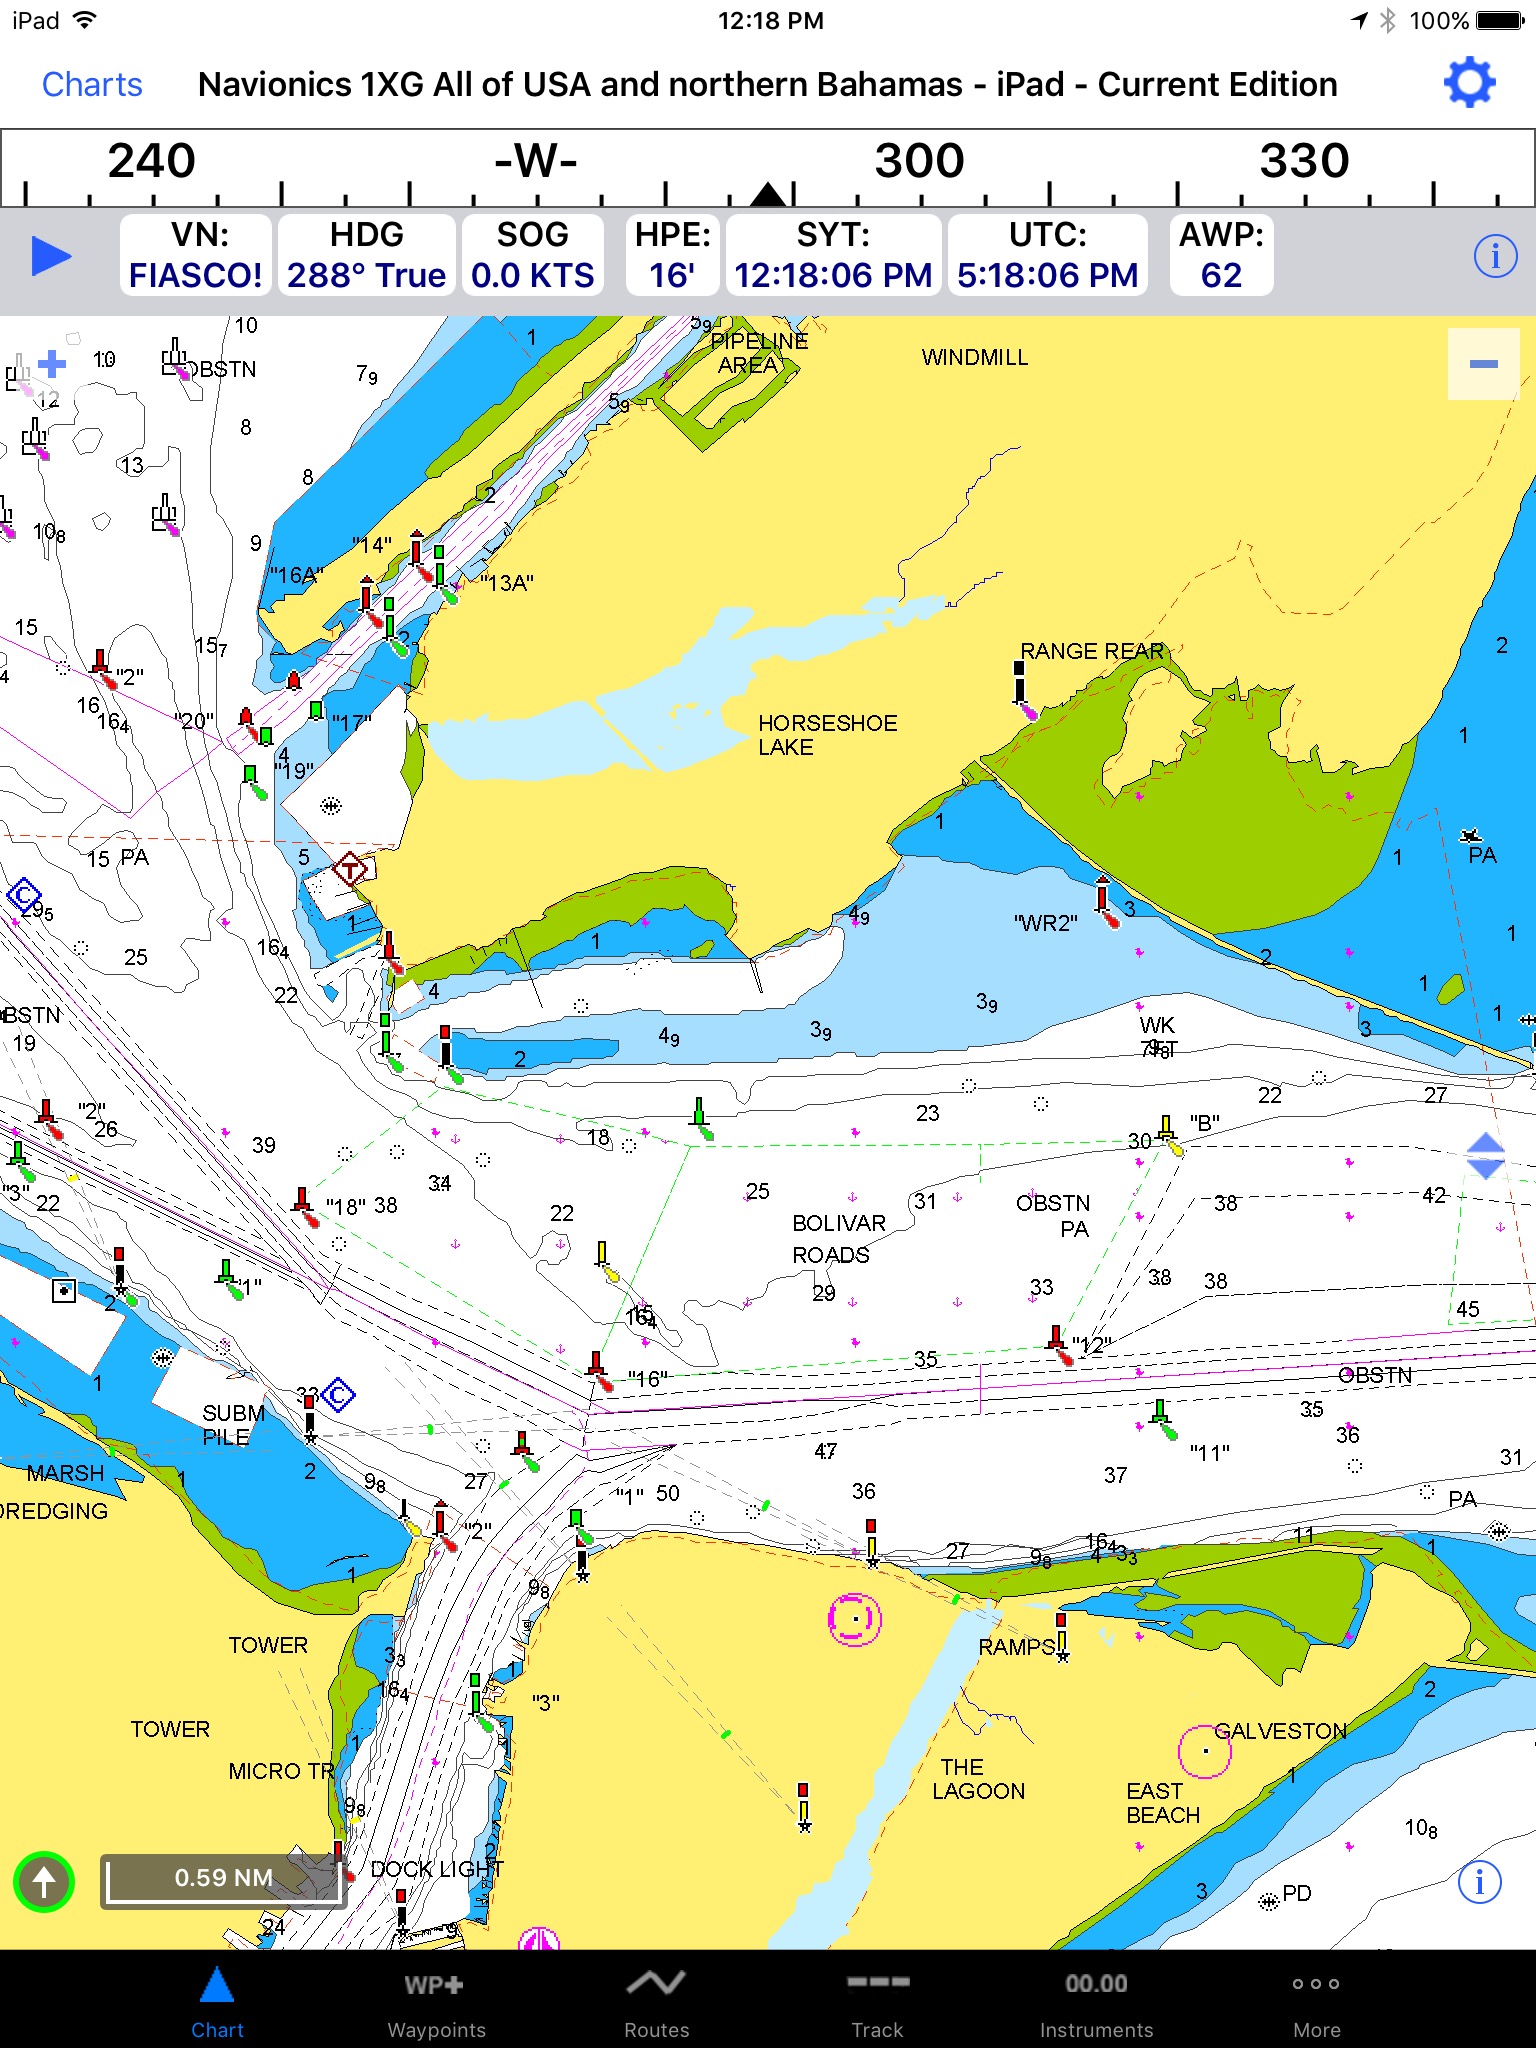
…zoomed out a bit…
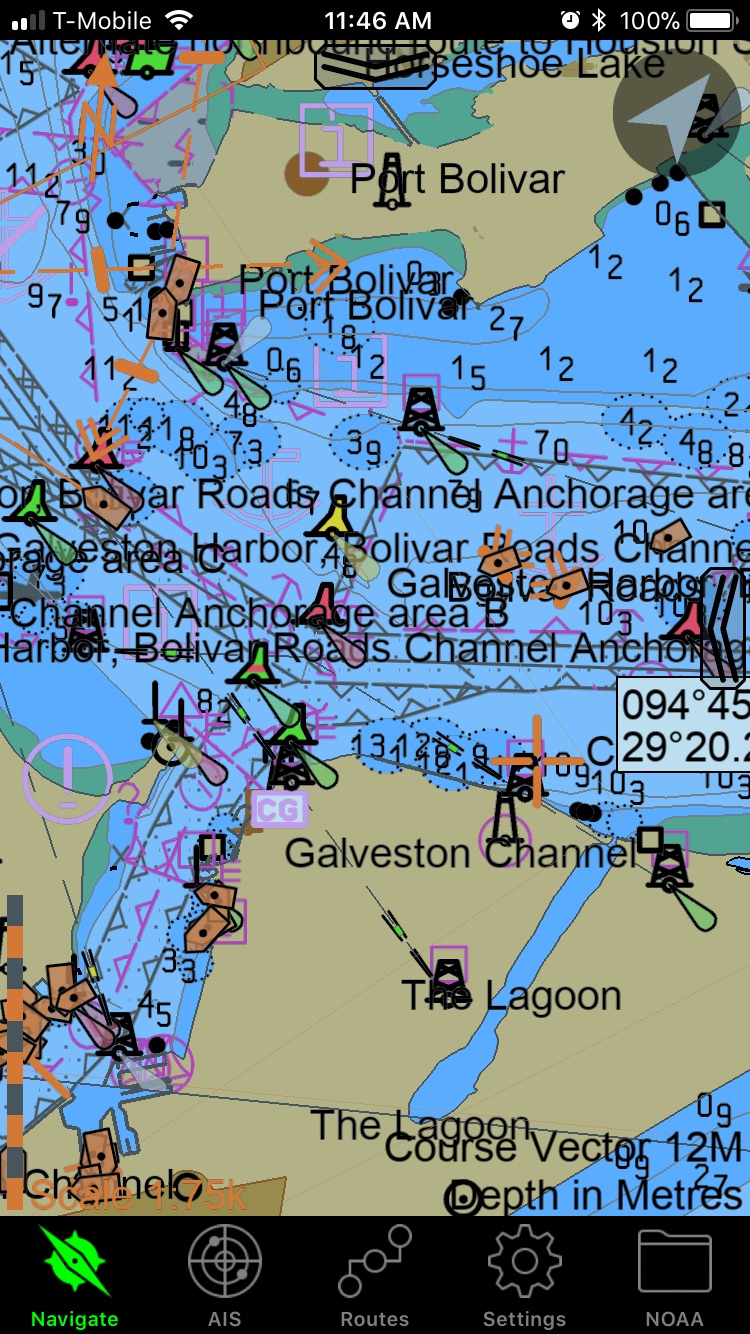
…then if you have on AIS names at wider views in SEAiq it really becomes unusable
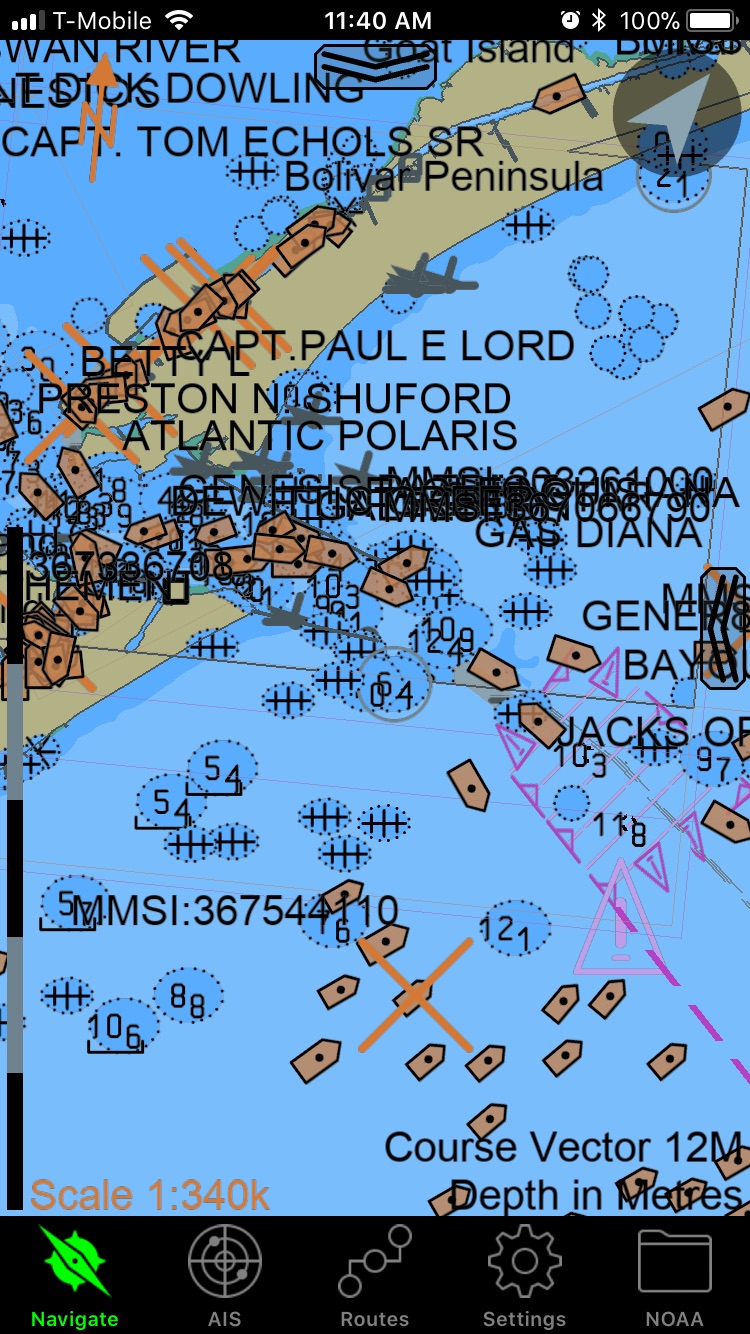
Without the AIS clutter (which you do obviously have control over via the settings in SEAiq) it’s MUCH better – but still not nearly as clear and detailed as what I’m seeing with the Navionics+ charts. Maybe this is just an issue with the NOAA ENC charts and not SEAiq. I don’t know. It’s just what colored my opinion.
But to exacerbate that problem, it seems the chart options are very limited (either NOAA or IHO) compared to iNavX which has TONS of options. So, again, it was another reason I drew that conclusion above.
3. Seemless integration with VentureFarther for satellite charts – just select an area, push a button and a satellite overlay appears on whatever charts you are using. We also use this feature a lot since we are often in poorly charted areas.
Now this is pretty cool. I’d never seen this application before. Can you save that stuff for offline use in SEAiq? iNavX has something similar when in wifi/cell range – integrating with Google maps. You select a point and get this popup…
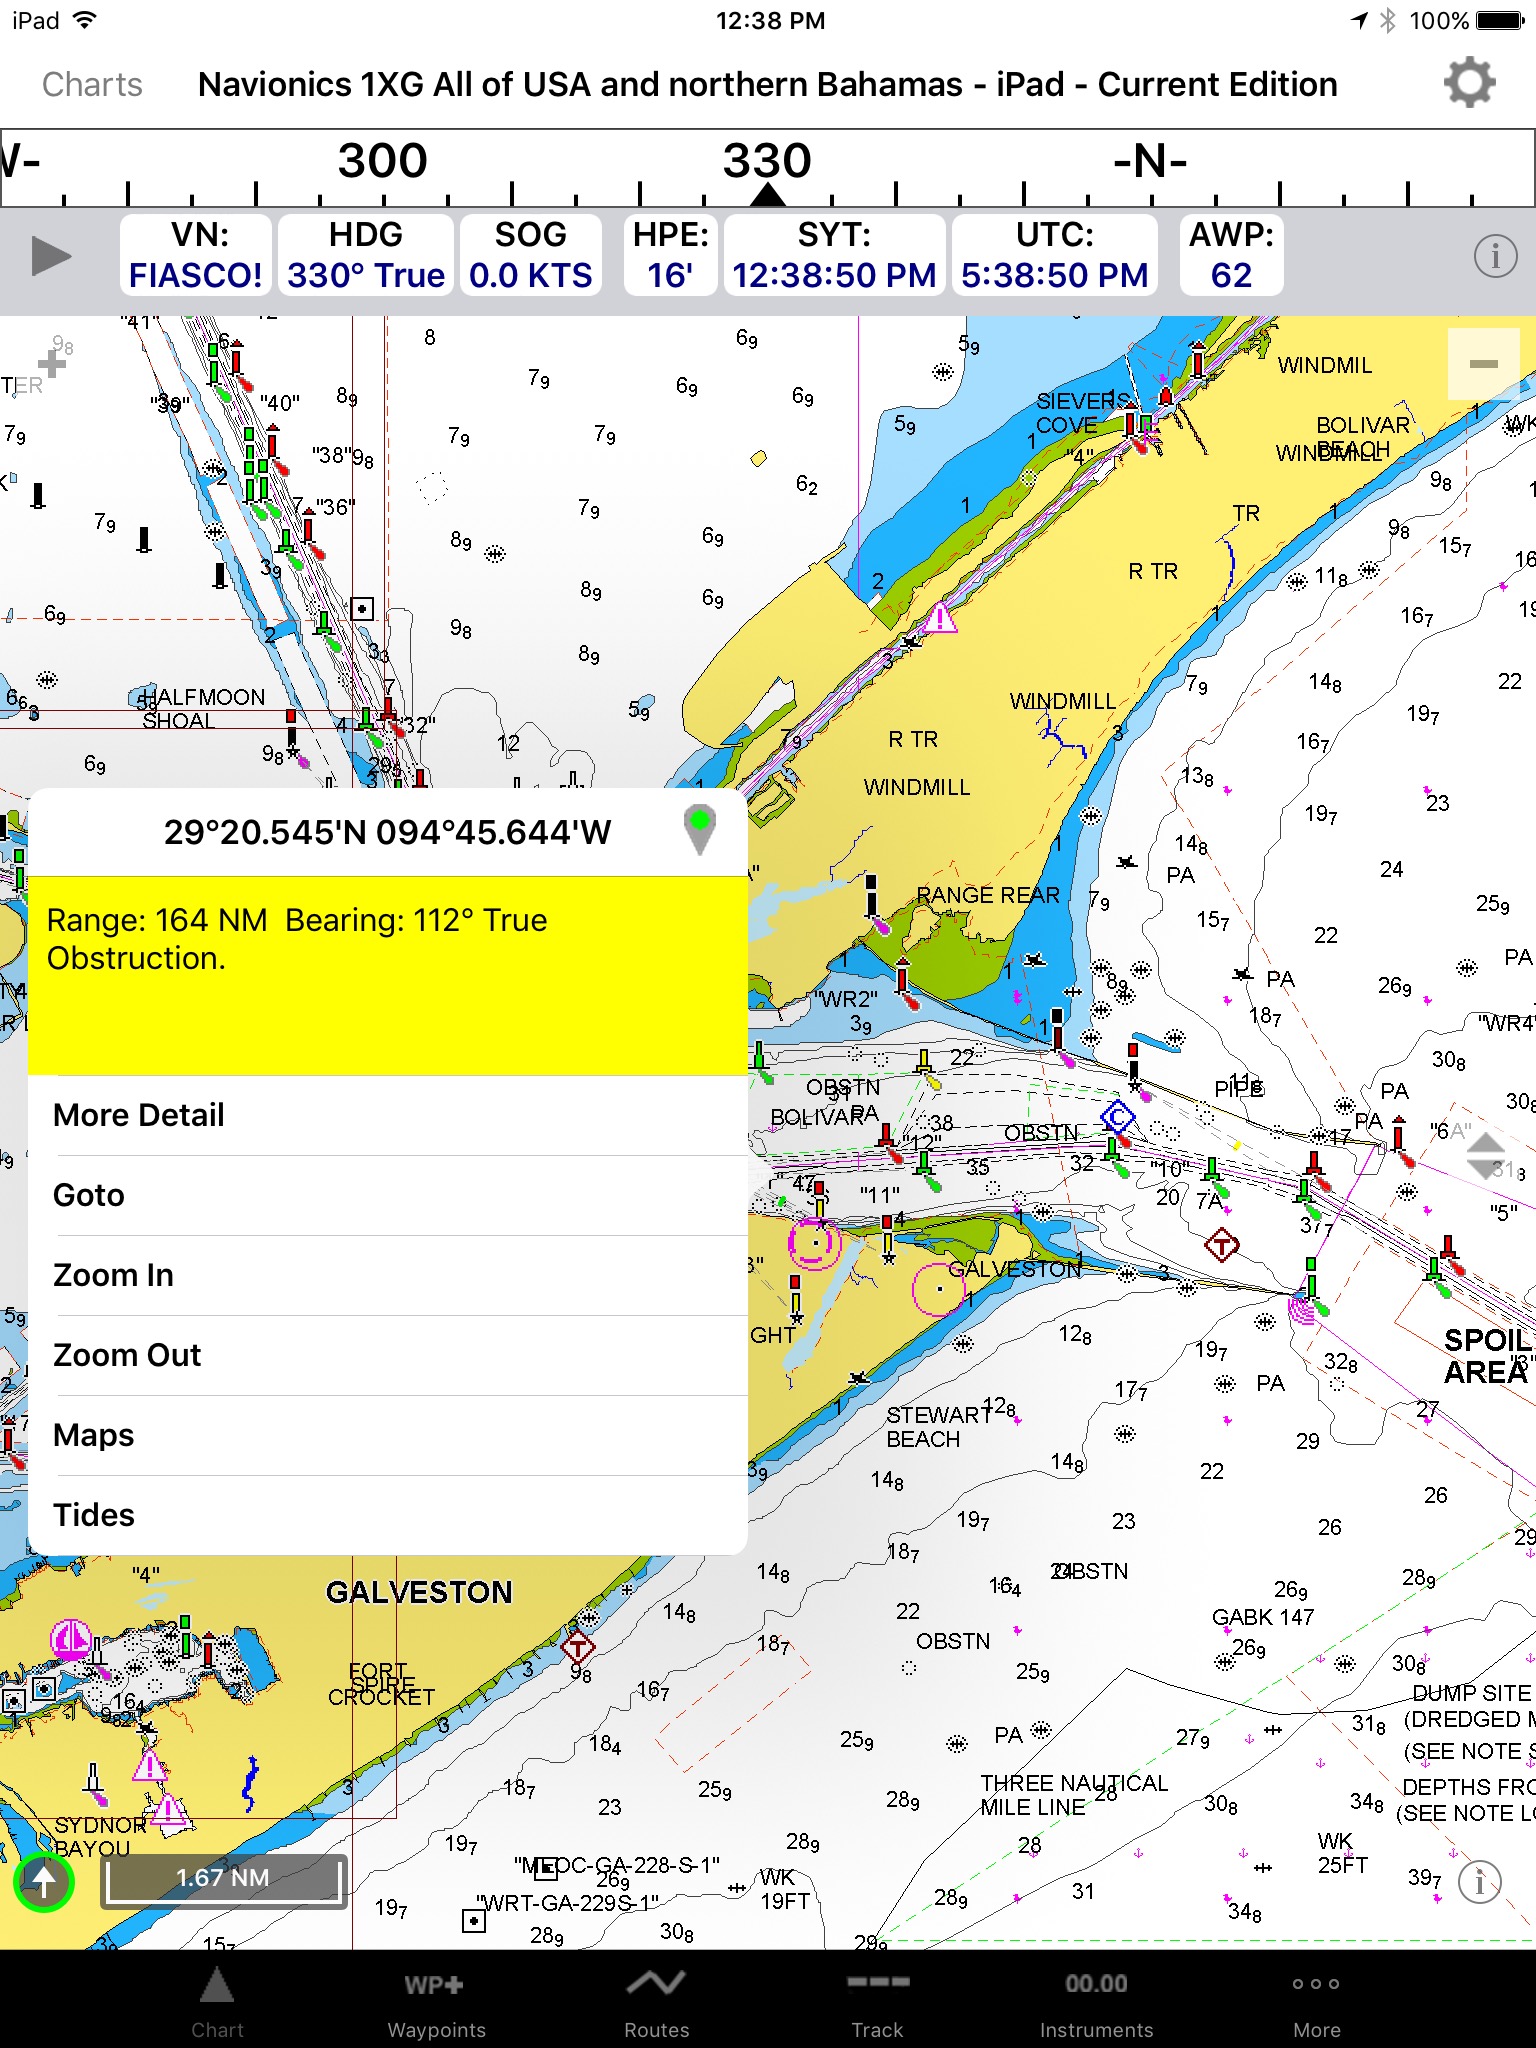
Hit map and you get this which you can pan/zoom/etc…
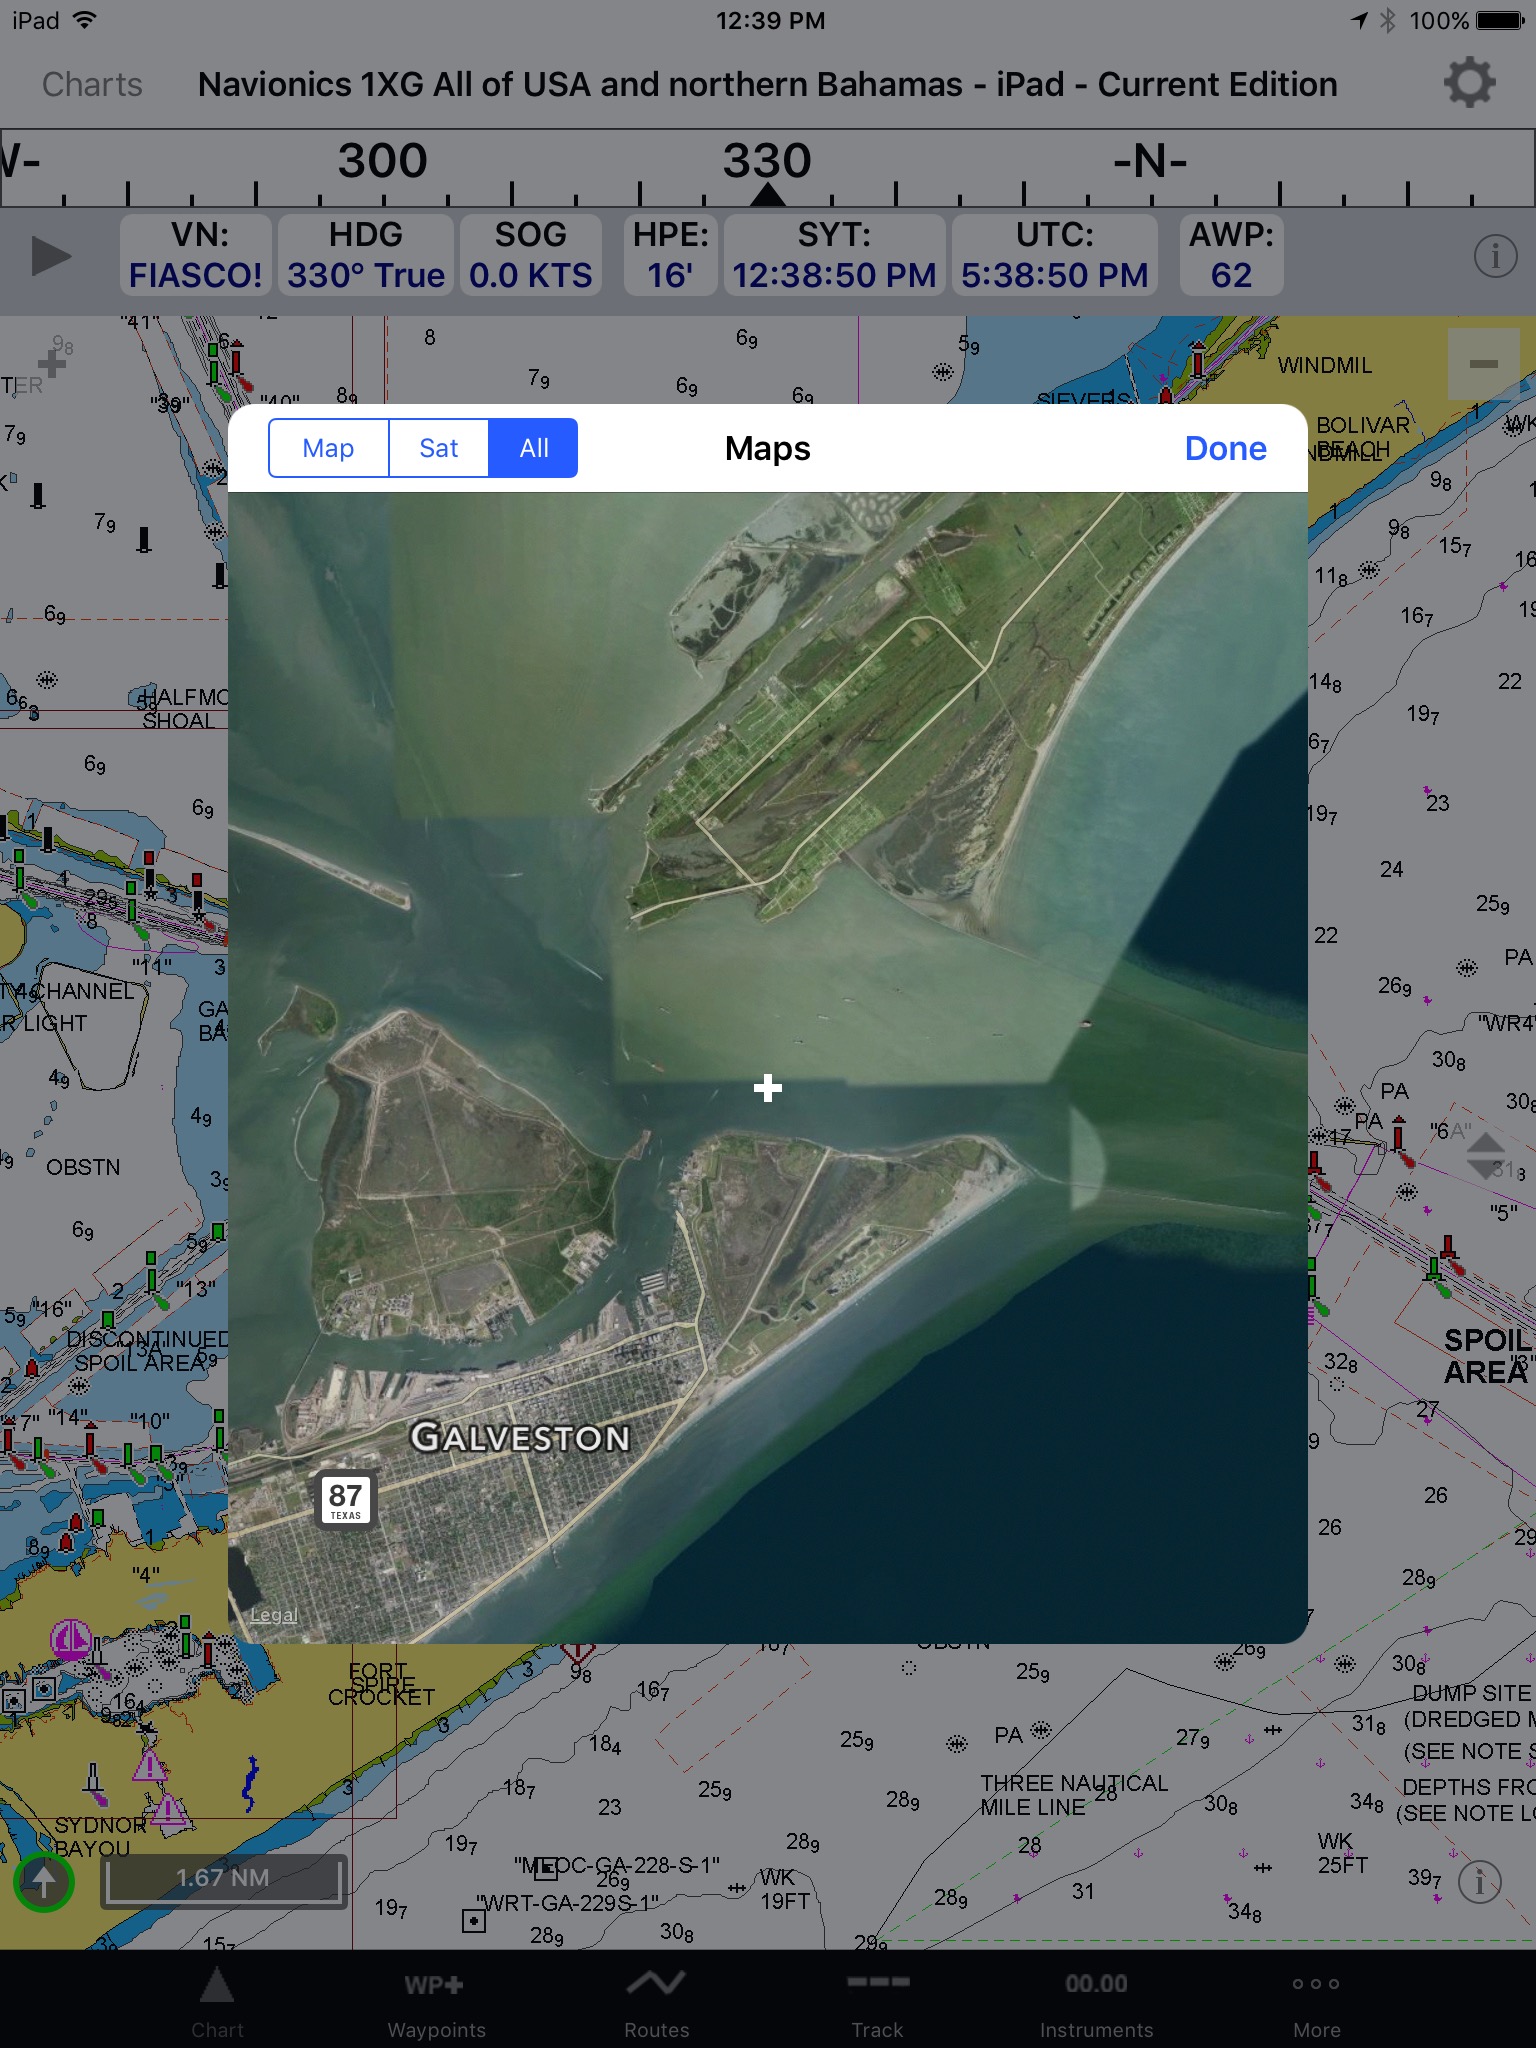
But to my knowledge you can’t save it for in-chart reference later (though you could obviously save it as a screenshot, etc.. That would be pretty sweet if you could bring it back up over the chart with your route overlaid like it seems you can with VentureFarther. Very, very useful for out of the way places.
Venture Farther is interesting in that it is also doing the crowdsourced bathymetry (“Indentured Cruising”) like Garmin/Navionics-cum-ActiveCaptain is doing…but appears to be open-source? As an aside, I’m curious if JeffS from AC is still working on this stuff with Garmin. I agree with you that Garmin/Navionics/etc. and other mass-manufacturer options are just not worth it if you want full capability and redundancy.
4. The AIS CPA crossing situation is represented like Vesper used to do and OCPN still does, with vectors from each ship ending where the CPA will be in the future.
Yeah, I don’t see any specific settings in iNavX for auto-extending the vectors for CPA…
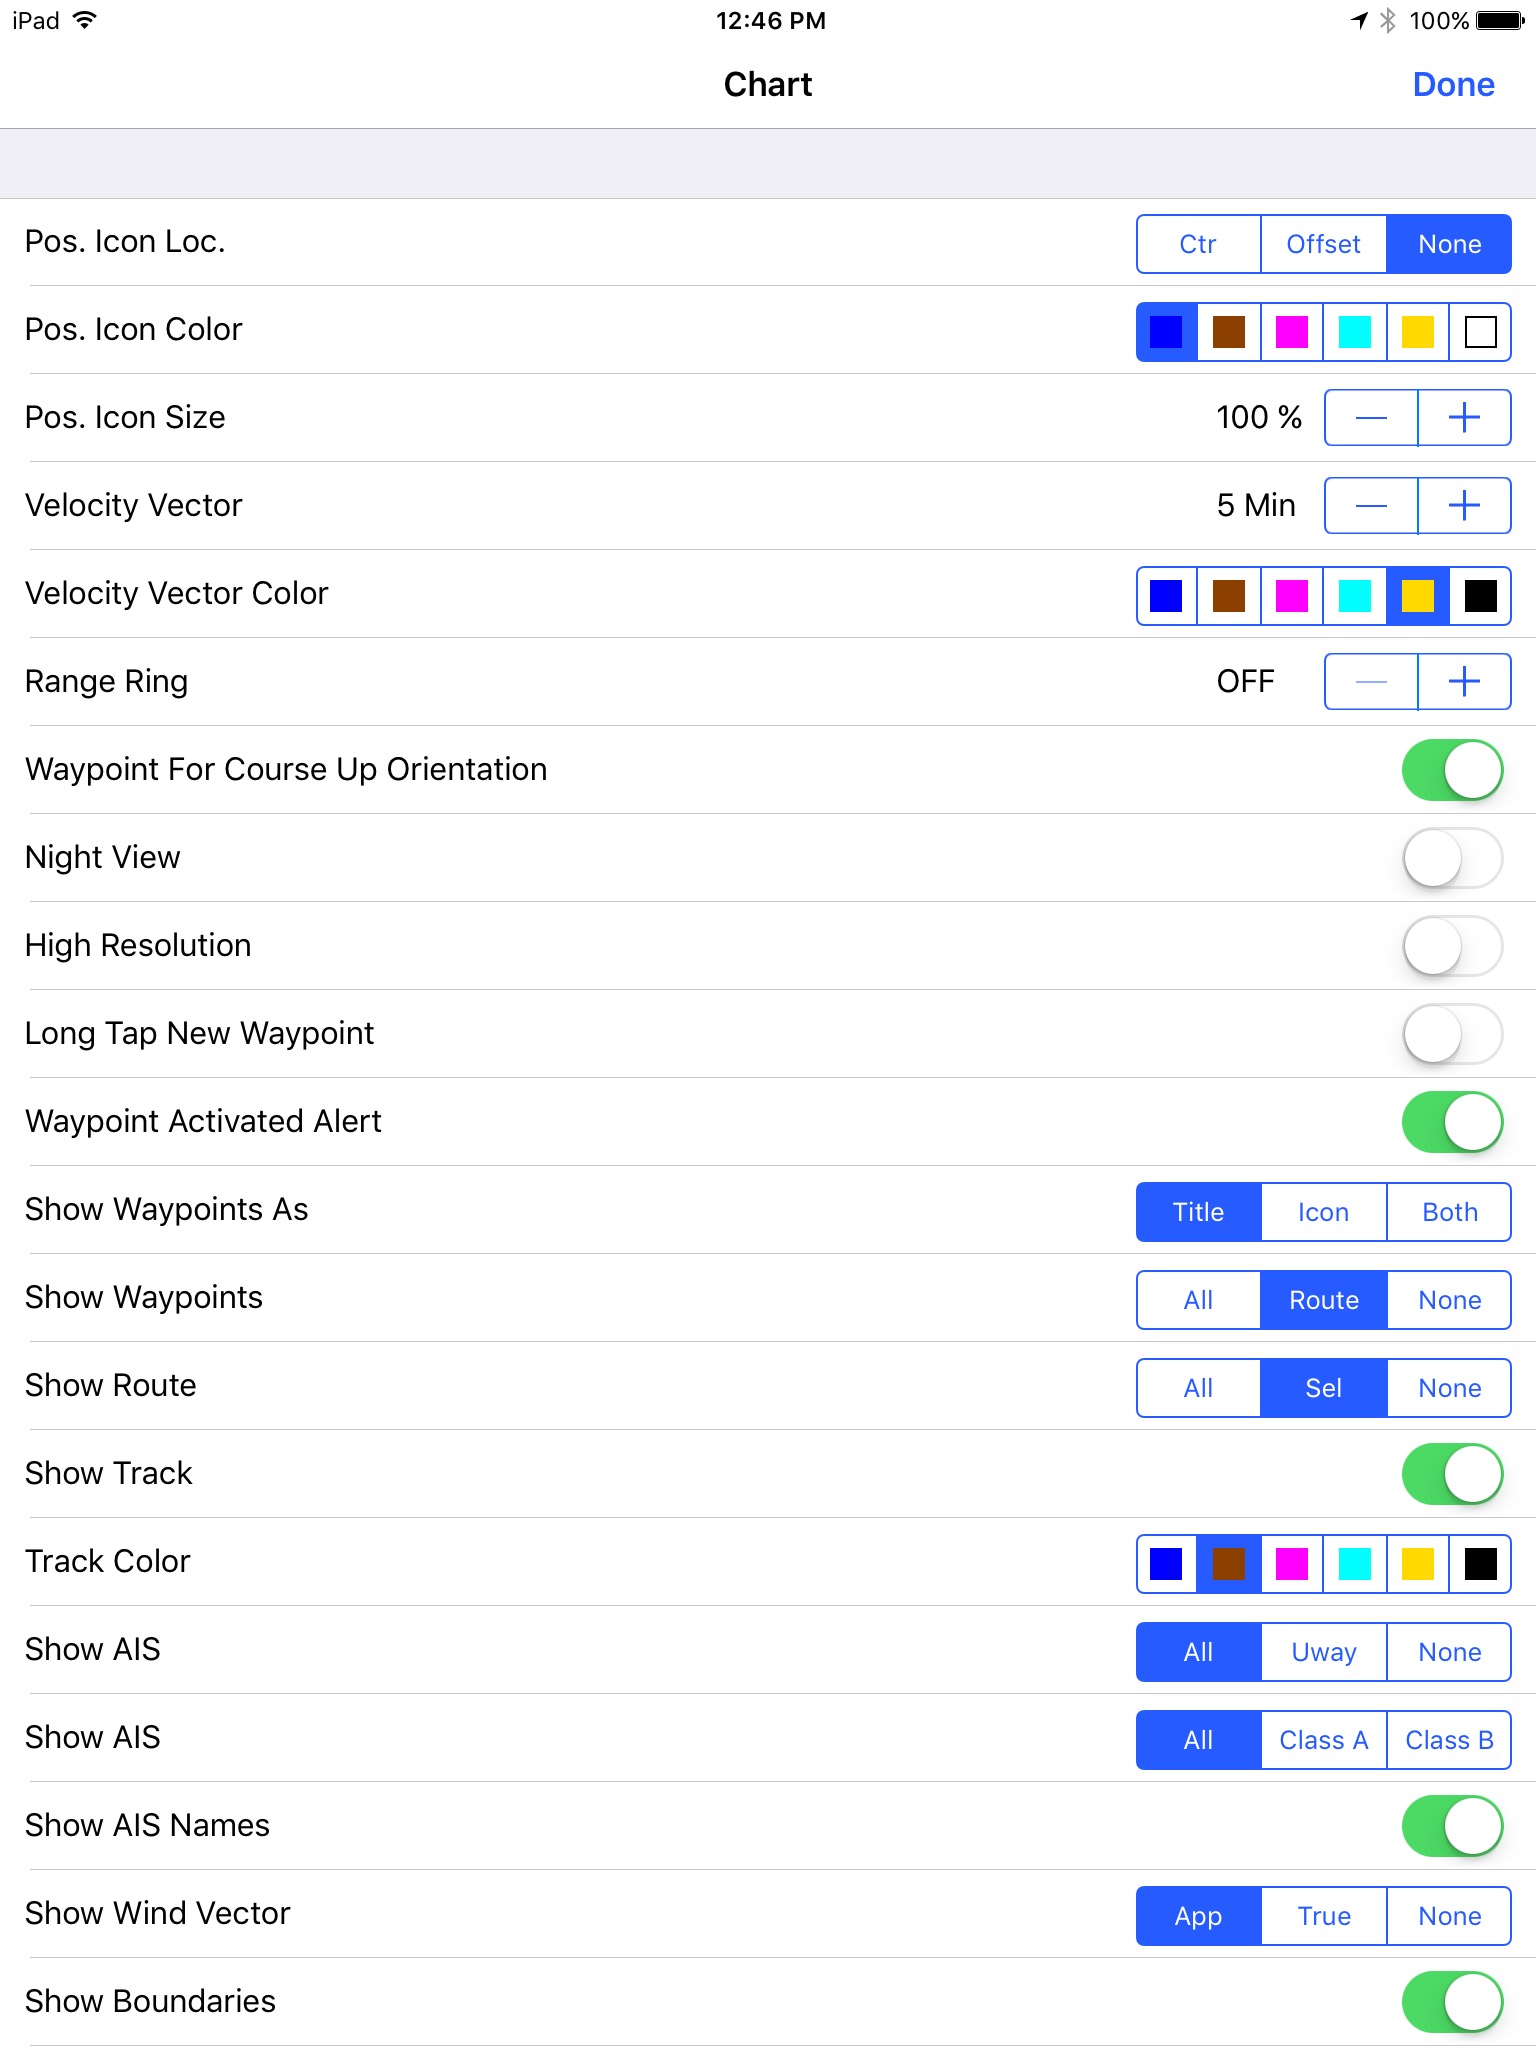
Is this the setting (at the bottom) in SEAiq you’re talking about? I suppose you can do that manually in iNavX by just extending the time on the vectors.
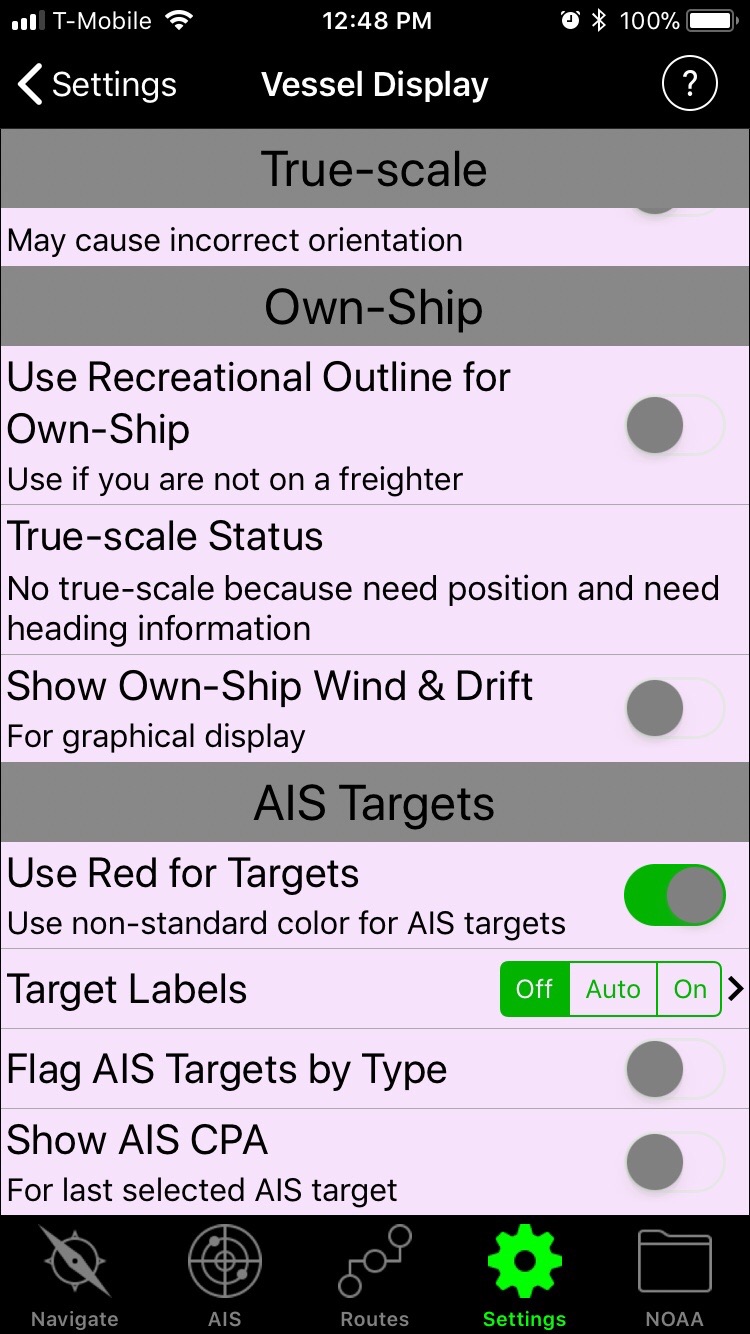
That auto-vectoring would be a nice addition for iNavX. Something similar may be there somewhere, I’ve just never seen it.
5. Seamlessly connects to NOAA chart libraries and updates all US raster and ENC charts for free (I think iNavX charges as part of their subscription?).
The NOAA raster charts come free with iNavX and you can update them as well as often as you’d like (though I have no idea how often those are even updated on NOAA’s side). But they are unquilted and a pain if you are sailing long distances. But as I’ve said above, I’m just not that impressed with even the NOAA ENC charts – at least as shown in my examples above – especially compared to the Navionics+ charts. So I don’t mind paying there.
If OCPN were on iPad, we would be using that just for its CM93 capability that SEAiq took away. Otherwise, they are about identical in terms of what we want.
Mark
I’ll keep playing with SEAiq. I’ll admit – I’m definitely not reviewing it from an informed, first-hand experience viewpoint as you are. And I know there’s a lot of personal preference in these kinds of things which color opinions. So I defer to you on that app.
But, I do want to say thanks for the feedback on this stuff with the specific examples. It makes these comparisons much more educational and fun.
Cheers.
Feel free to join in the conversation. Lot’s of cool things to learn here.
I have on PPU. KSN55C working with SEAiq Pilot but I see other plataforms more power exp Transas .